Examples
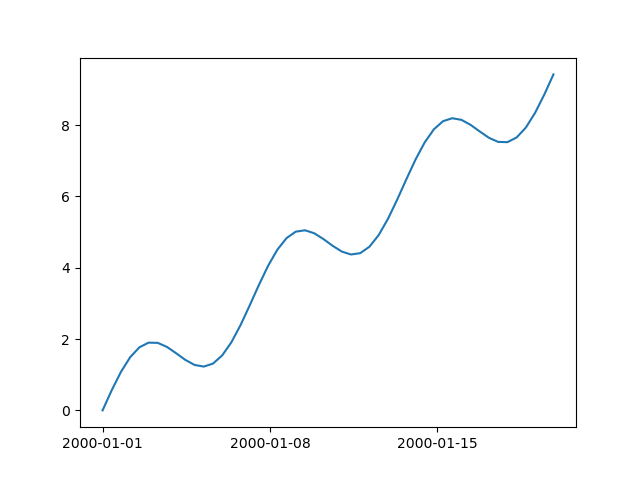
Basic Usage
nc-time-axis works by adding converters to the flexible units registry of
matplotlib. To register its converters, simply import nc_time_axis. Then you
will be able to make plots with cftime.datetime axes.
In [1]: import cftime

In [2]: import matplotlib.pyplot as plt

In [3]: import nc_time_axis

In [4]: import numpy as np

In [5]: fig, ax = plt.subplots(1, 1)

In [6]: x = np.linspace(0, 6 * np.pi)

In [7]: y = 0.5 * x + np.sin(x)

In [8]: times = cftime.num2date(x, units="days since 2000-01-01", calendar="noleap")

In [9]: ax.plot(times, y);

In [10]: fig.show()
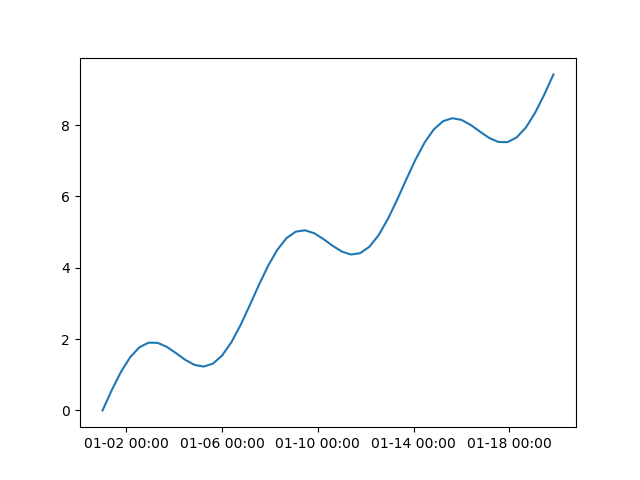
Setting the Axes Ticks and Tick Format
In the first example, the ticks and tick label formats were chosen automatically
using heuristics in nc-time-axis. If you would like to explicitly set the tick
positions and label format you may do so using
matplotlib.axes.Axes.set_xticks() and CFTimeFormatter. The
CFTimeFormatter takes in a date format string (see the Python
documentation
for acceptable format codes) and the calendar type of the axis (see
the cftime.datetime documentation for valid calendar strings).
In [11]: fig, ax = plt.subplots(1, 1)

In [12]: ax.plot(times, y)
Out[12]: [<matplotlib.lines.Line2D at 0x708824989bd0>]

In [13]: ax.set_xticks(
   ....:     [cftime.datetime(2000, 1, day, calendar="noleap") for day in range(2, 19, 4)]
   ....: )
   ....:
Out[13]:
[<matplotlib.axis.XTick at 0x70882498b390>,
 <matplotlib.axis.XTick at 0x708824989950>,
 <matplotlib.axis.XTick at 0x7088249bc190>,
 <matplotlib.axis.XTick at 0x7088249bc910>,
 <matplotlib.axis.XTick at 0x7088249be490>]

In [14]: formatter = nc_time_axis.CFTimeFormatter("%m-%d %H:%M", "noleap")

In [15]: ax.xaxis.set_major_formatter(formatter)

In [16]: fig.show()